Real stem counts behind every labor and yield figure
Record how many stems grow in each work area in a few clicks, so labor plans and yield reports start from real numbers instead of estimates.
Two blocks of the same size, two crews, and one of them picks fewer kilos per hour. Is that crew slower, or is there simply more crop in the other block? Without knowing how many stems stand where, nobody can say, and every comparison is a guess.
With Agromigo you record the stems per work area at the start of a crop cycle. It takes a few clicks, even for a whole block at once. From then on, labor plans and yield reports start from real numbers.
In this video
Migo shows you how to find an inventory, read its stem counts, and record a new count for a work area.
The list. Crop Inventories lists what you count in the greenhouse, such as stems per crop, with the unit beside each. The chips above the list pick out inventories that need attention. Select a row, and that inventory opens beside the list. An inventory says how many plants grow in each work area, so labor plans, yield and cost per stem start from real numbers.
At the start of a crop cycle, you record how many stems grow in each part of the greenhouse. For the peppers, that is still missing.
- Pepper – Stems. Select it at the top of the list. The orange dot on its row says something needs your attention.
- Default quantity per m². In the Inventory Details card, it says how many stems you expect per square meter: 2.5 for these peppers. For a row in the crop cycle with no figure of its own, Agromigo multiplies the row’s size by it and puts that count on the crew’s work entries, so stems per hour needs no counting. A row with its own figure always wins, and a row with no recorded size gets no count.
- The Next steps card. It says what is wrong: no work areas have been added, so nothing is being counted.
- Add areas. The button at the right of that card opens every work area on the site in a sheet.
- Search. The search box at the top of the sheet finds the rows where the peppers grow, best match first.
- Tick them all. The box in the list’s header, at its top left, selects every row you found at once.
- Per square meter. In the bar at the bottom of the list, enter how many stems grow per square meter. Unlike the default, this gives every ticked area its own figure, worked out from its size.
- Apply. In the same bar, Apply fills in every ticked area at once. You can still adjust a single row afterward.
- Totals. At the top of the sheet: how many areas are covered, and how many stems over how many square meters.
- Save. In the footer at the bottom right, Save stores every change in one go and tells you how many that is.
- Back on the record. The work areas card lists each area with its own quantity. Harvest and labor figures for the peppers now have a real starting point.
- A new inventory. New, in the top right corner, starts another inventory: a name and its crop cycle in the Basic Data card, and its unit and default per square meter in the Quantity Values card. Cancel closes it without saving.
Tips
- Check the apply mode every time. The grid opens on Per m². Type 3000 meaning three thousand stems, and you get three thousand per square meter. For a fixed number, switch to Absolute first.
- Use whole numbers, and clear instead of typing zero. Quantities must be whole numbers above zero, so round a density that does not divide evenly. To remove a quantity, use Clear Selected. A zero counts as empty and gets replaced by the default per square meter.
- Update the count when the crop changes. In a high-wire crop, stem density goes up and down during the season. After a round of twinning or stem removal, update the inventory so your comparisons stay fair.
Read more
The user guide explains inventories, the quantities grid and why stem and head density matters for labor, not just for yield.
Try it free for 1 month, no credit card needed.
More stories
-
 2 min
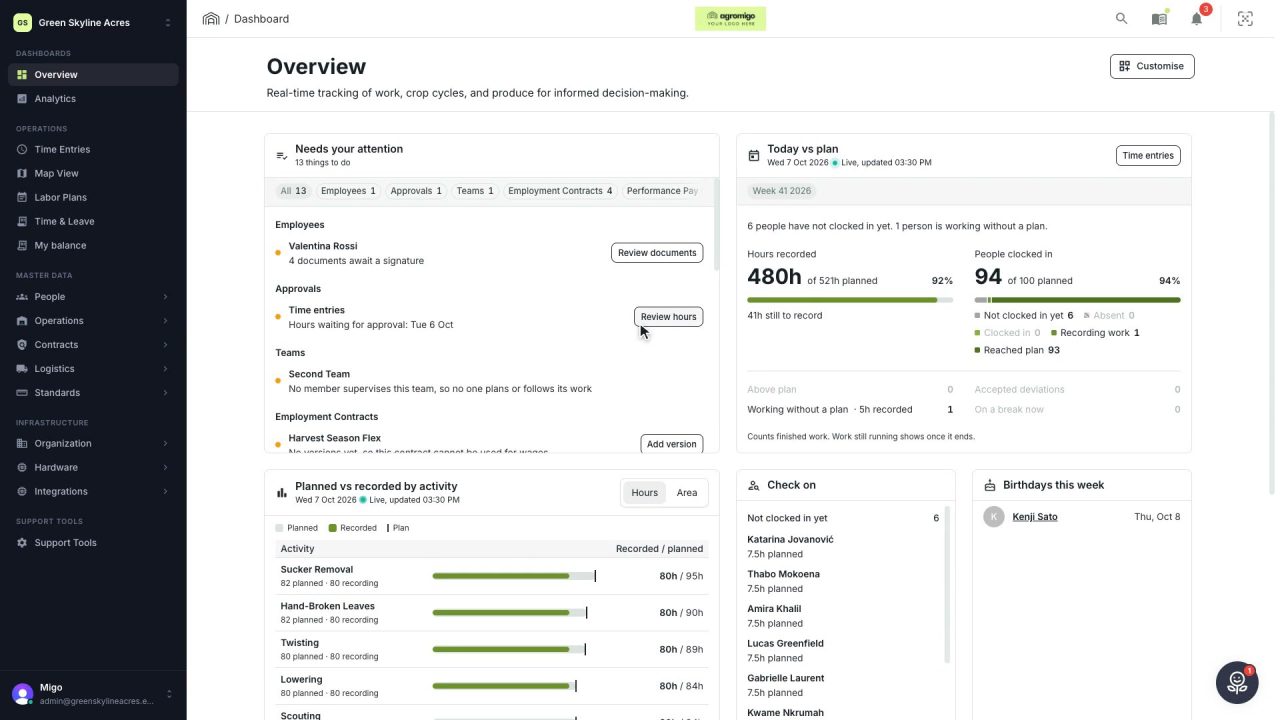
2 min See how today is going against the plan, while it is still going
The Today vs plan card on the Overview follows today's labor plan live. You see whether the day is on track, who is in and who to check on, without opening the plan or the time entries.
Read the story -
 2 min
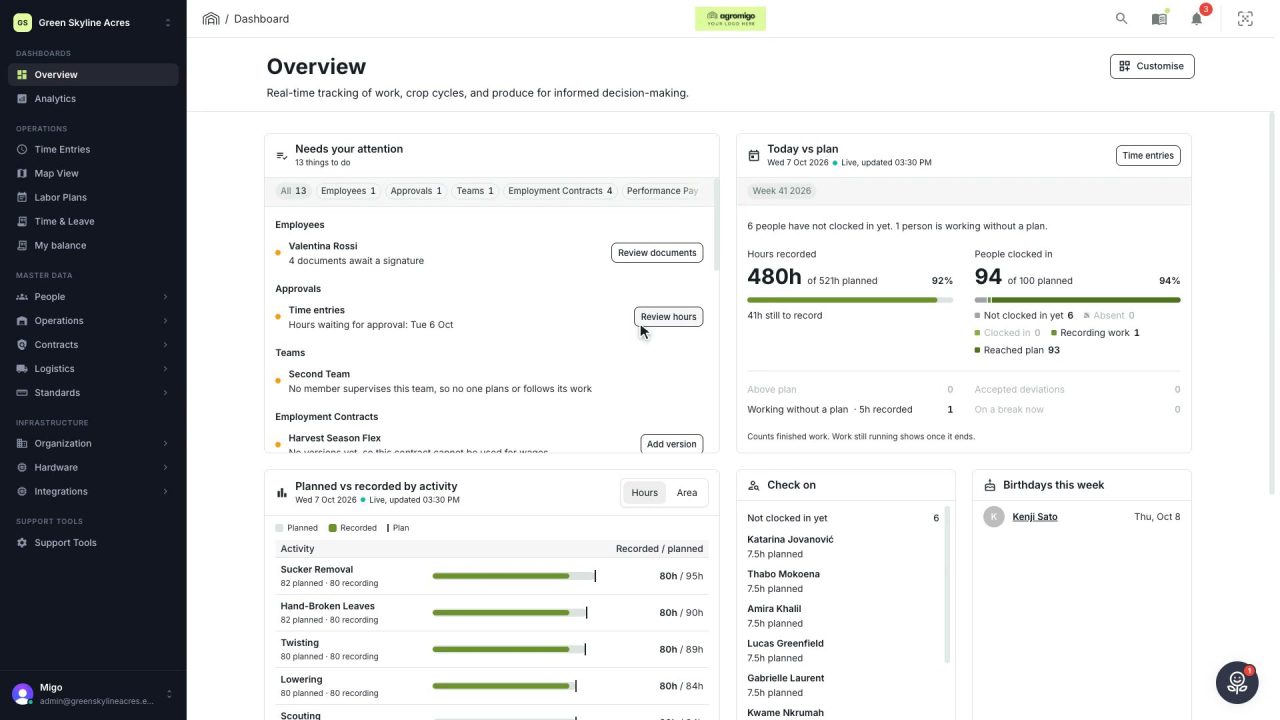
2 min Arrange the Overview the way you work
Move, resize and hide the cards on the Overview, so the figures you check every day are at the top and a long list has the room it needs.
Read the story -
 2 min
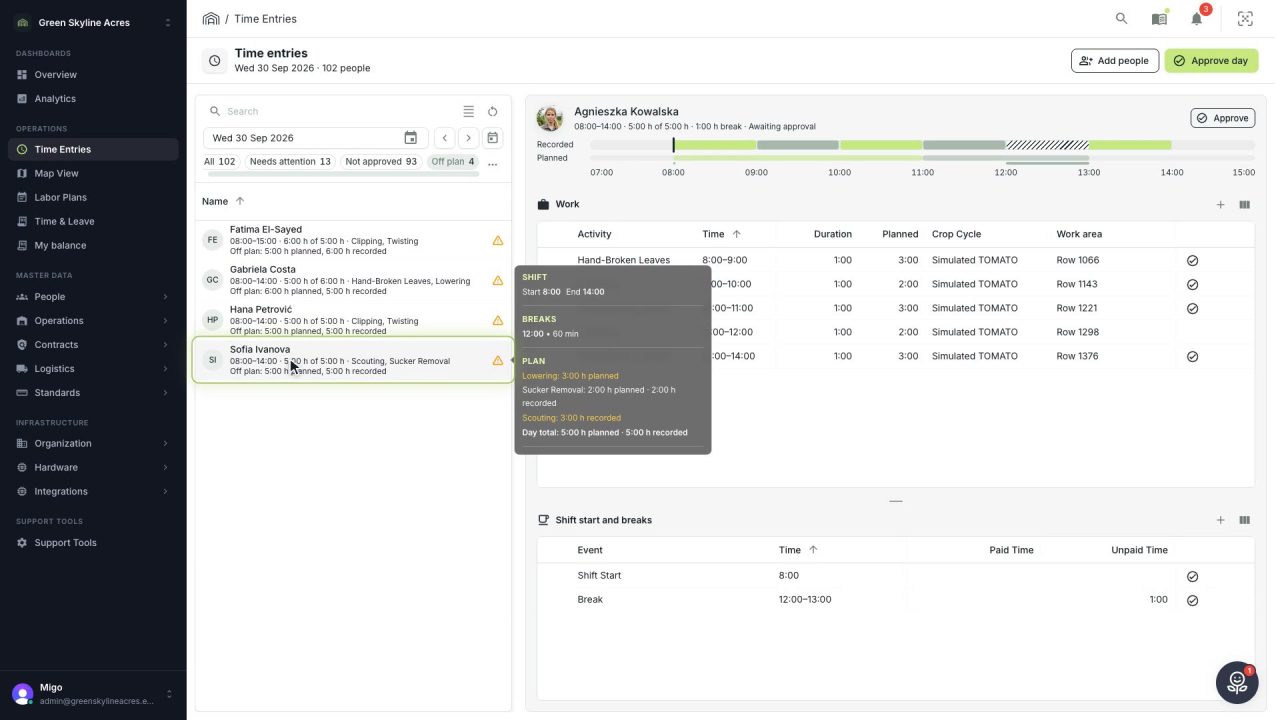
2 min See whose day went differently from the plan
Check a work day against the labor plan, see who worked something else or did not show up, and accept a change of plan that had a good reason.
Read the story