See on one map where every open issue on your site is
The Issues map colours every work area by its most severe open issue, so you see at a glance which rows have a problem and how serious it is.
A list of issues tells you what was reported. It does not tell you that three of them are in the same row, or that the row with the spider mite sits right next to the one where the heating failed last week. For that you need the greenhouse in front of you.
In Agromigo, the Issues map shows your site with every open issue on it. Each work area takes the colour of its most severe open issue, and a pin marks where a phone reported it.
In this video
Migo shows you how to see at a glance where the open issues on your site are, and how serious each one is.
- The Issues map. Your site, with every work area that has an open issue in the colour of its most severe one: red for high, orange for medium, grey for low. Pointing at a work area counts its open issues.
- Zoom in. Scroll to zoom in on a row.
- Click the row. Its issues open beside the map.
- Two issues. This row has a pest of medium severity and spider mite, high, which is why it is red.
- The toolbar. It narrows the map to one severity or one category, such as only the pests.
- All. It adds the issues already resolved or dismissed, so you see which rows keep coming back.
One look shows where your open issues are and how serious, row by row, without reading through a list.
Tips
- Open it from the list. On the Issues page, the Show on map button opens the map with the same issues.
- One issue, one pin. The Location card of an issue shows the same map with only its own pin.
Read more
The user guide explains the Issues list, Needs your attention and the map, and the Issue Hotspots report counts the issues per zone and work area.
Try it free for 1 month.
More stories
-
 1 min
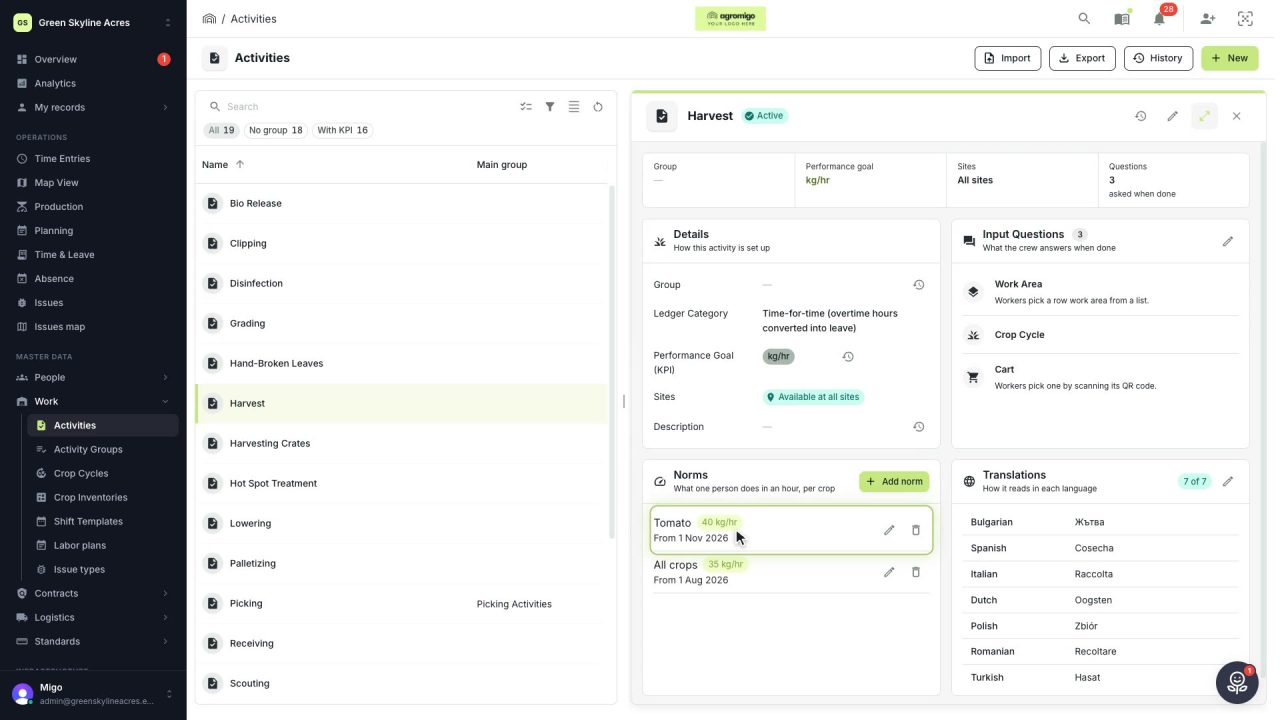
Know how fast the work goes, per crop
Set what one person does in an hour for each activity, per crop cycle and season, so every labor plan turns a target into the hours and people it takes.
Read the story -
 2 min
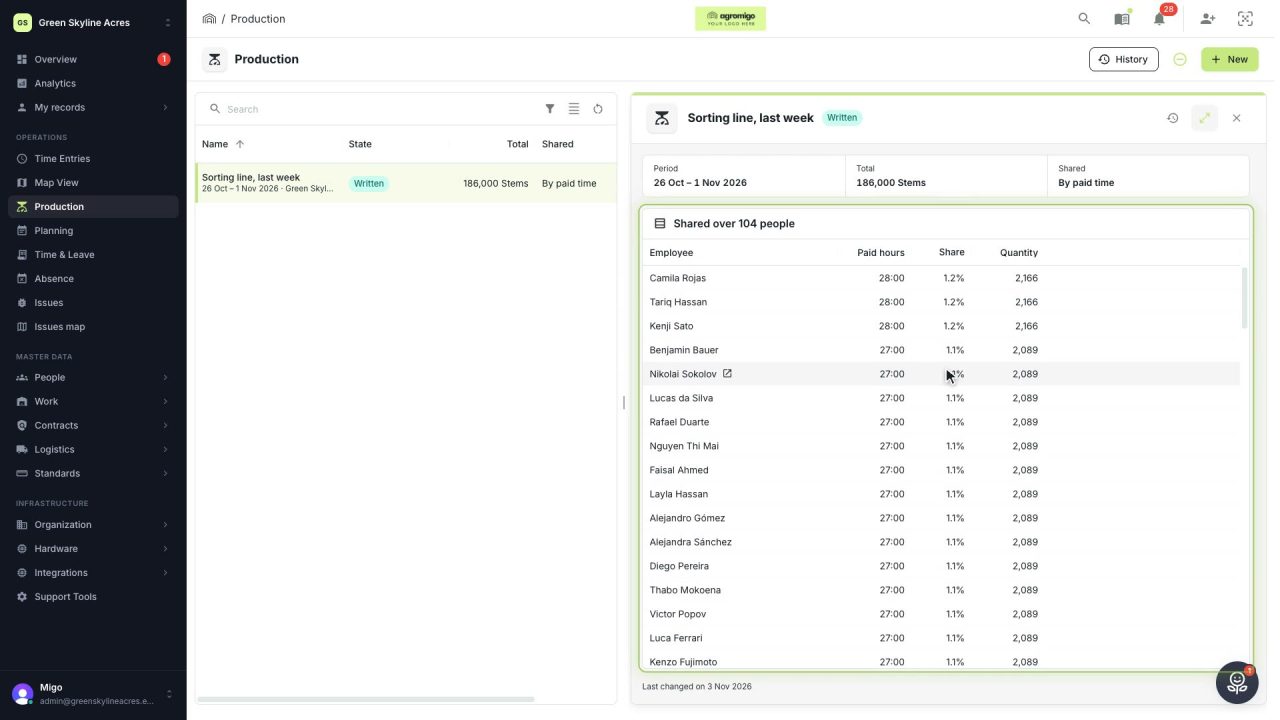
Share a week of production over the people who did the work
A total that is only known in bulk, such as a week of chrysanthemum stems from the sorting line, shared over everyone who worked by their paid hours, onto their own time entries, where it becomes stems per hour per person, team and crop.
Read the story -
 2 min
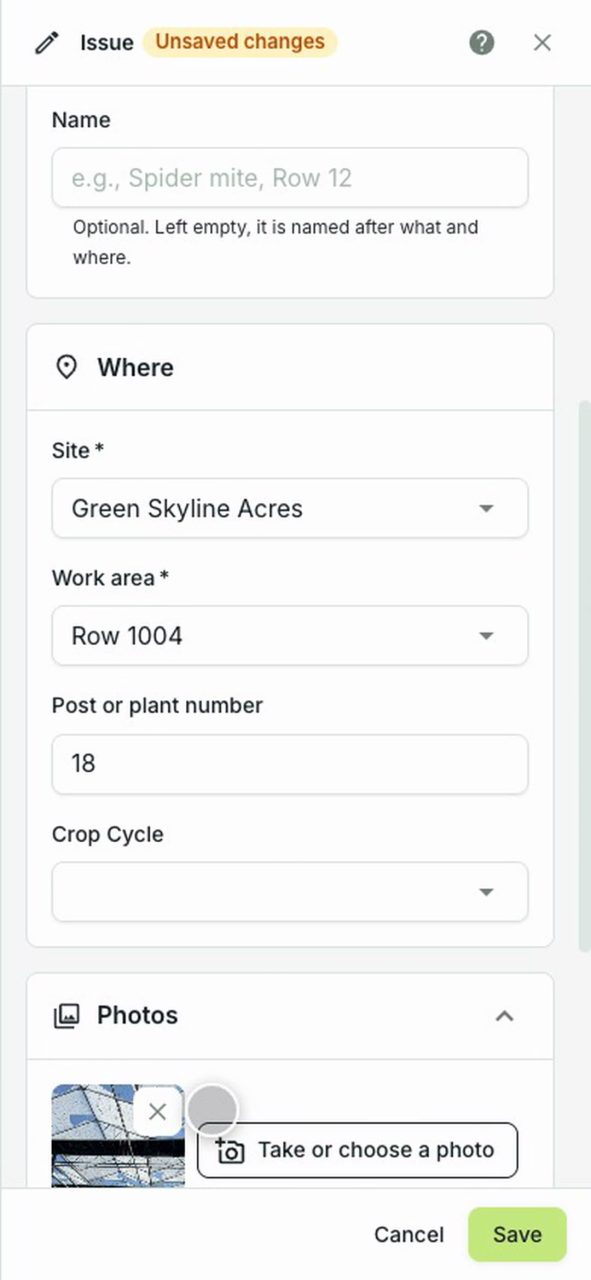
A worker reports broken glass from their phone
A worker reports something broken from the dashboard on their phone, with the row, the post and a photo, in under a minute, and it reaches whoever handles it.
Read the story