Share a week of production over the people who did the work
A total that is only known in bulk, such as a week of chrysanthemum stems from the sorting line, shared over everyone who worked by their paid hours, onto their own time entries, where it becomes stems per hour per person, team and crop.
The sorting line knows how many chrysanthemum stems left the greenhouse last week. It does not know who harvested them. So the total ended up in a spreadsheet, divided by hand over the crew, and typed back in, or it never reached the people at all, and performance pay was worked out from estimates.
In Agromigo a production total is shared for you. You say how much, for which week, and how to share it, and every person who worked receives their share on their own time entries. From there it counts like any quantity your crew records.
In this video
Migo shows you how to share a production total over the people who did the work.
The list. Production, in the menu under Operations, lists the production totals you shared. This one is last week’s total from the sorting line.
- The details. Select an allocation to see it. Written means every share is on the time entries.
- How it was shared. At the top: the period, the total, and how it was shared, here by paid time.
- Who received what. Below it, each person’s paid hours, their share and their amount. Agromigo worked out each share from the paid hours, so nobody divided the total in a spreadsheet.
- A new total. Choose New. The site is filled in, and the period opens on last week.
- The unit and the total. Choose the unit, then type the total: here, the stems the sorting line counted.
- How to share it. By paid time follows each person’s paid hours in the period. It can also be equal, or by completed area.
- Narrow it down. Under Narrow it down, choose the activity, here Harvest, and the crop cycle, here the chrysanthemums, so only the people who harvested that crop share the stems.
- Who receives what. Next shows everyone who harvested the chrysanthemums in the period, with their paid hours and the amount each receives. Nothing is written yet.
- Set an amount by hand. Type an amount for someone and it is set by hand. The rest of the total is shared over everyone else at once.
- Apply. Apply writes each share onto that person’s time entries. Approved days receive their share too, and stay approved.
Each share counts like any recorded quantity: in the timesheet, in performance pay and in your reports, where a measure such as stems per hour reads per person, team and crop cycle.
What the shares make possible
A weekly total from the sorting line says what left the greenhouse. On its own it says nothing about who produced it, at what rate, or where. Once each person’s share sits on their time entries, next to the hours it took and the area it covered, the total becomes a set of answers:
- Stems per hour per person. Attach a measure such as stems per hour to the harvest activity, and every report groups it by employee, exact for that person’s hours.
- Per team and per crop cycle. The same measure regrouped by team, work area or crop cycle, so a slow crop or a strong crew shows as a rate, not a guess.
- Stems per square metre. A measure of quantity over area reads the yield of each work area from the same shares.
- Performance pay on real figures. A piece rate or bonus counts the shares as pieces, so pay follows what was produced.
- The produce overview and your warehouse. The daily produce per zone and crop cycle, and the BI datasets, read the same numbers.
Tips
- Share a total for several weeks at once. A period can span up to 31 days, and shares still follow each person’s paid hours over the whole period.
- Narrow it down when a total belongs to one crop or team. Leave it open, and every person who worked at the site in the period takes part.
- Let your sorting line send the total itself. The API action
allocate-productionrecords an allocation exactly as the dashboard does, marked From API. - Change it, and the shares follow. Changing an allocation rewrites the shares, and withdrawing it takes them back.
Read more
The user guide explains production allocation step by step, measures such as stems per hour, and performance pay, which the shares feed.
More stories
-
 1 min
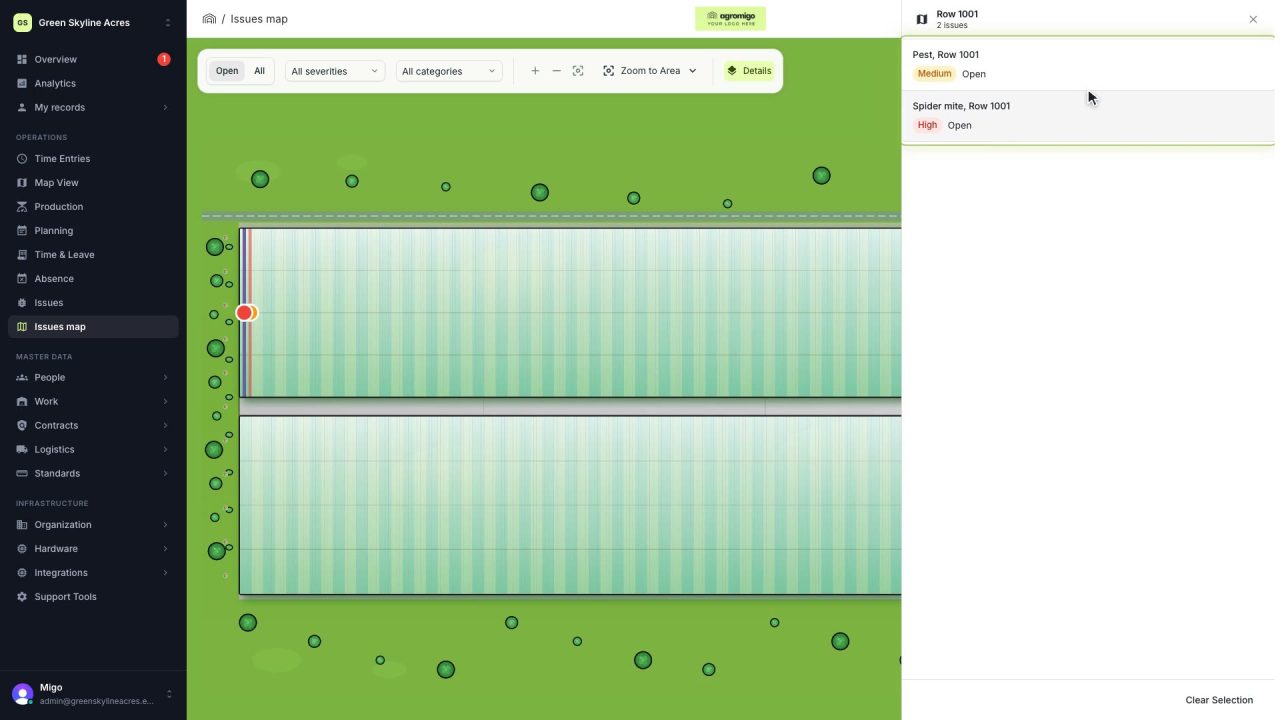
See on one map where every open issue on your site is
The Issues map colours every work area by its most severe open issue, so you see at a glance which rows have a problem and how serious it is.
Read the story -
 1 min
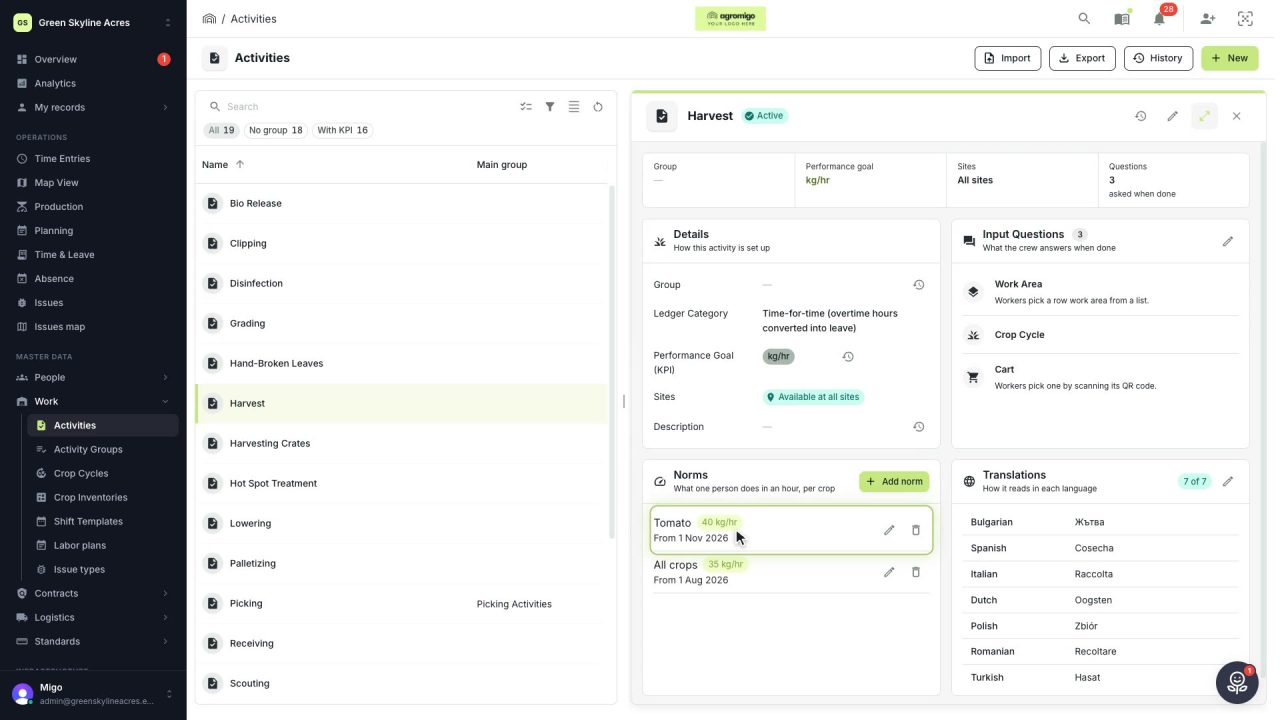
Know how fast the work goes, per crop
Set what one person does in an hour for each activity, per crop cycle and season, so every labor plan turns a target into the hours and people it takes.
Read the story -
 2 min
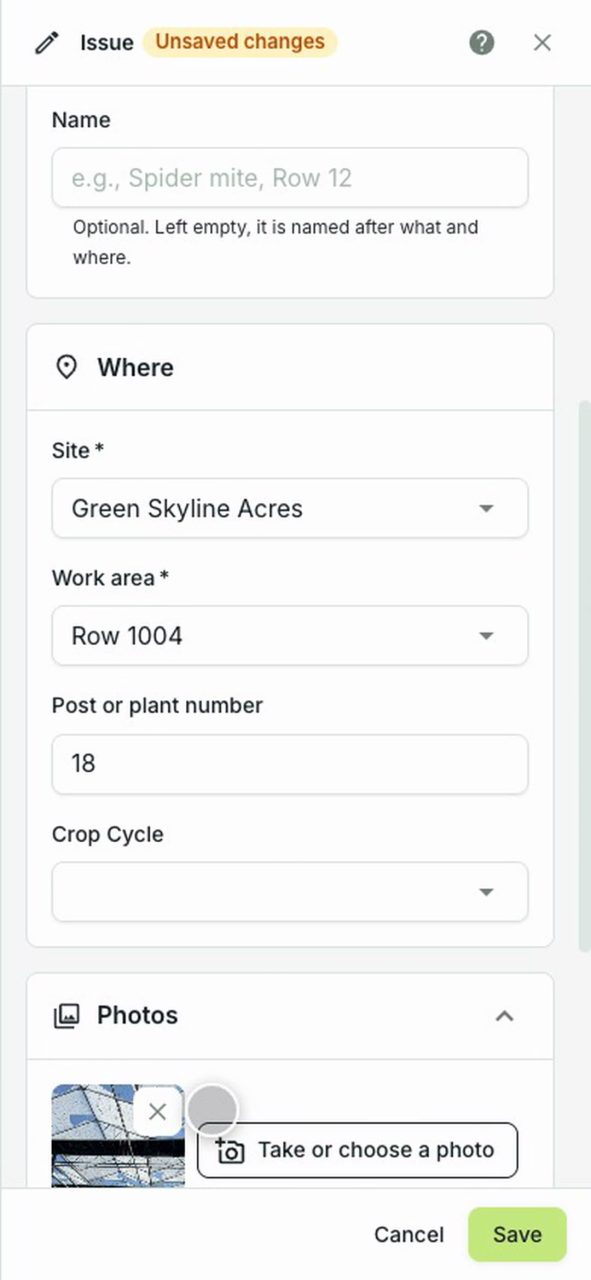
A worker reports broken glass from their phone
A worker reports something broken from the dashboard on their phone, with the row, the post and a photo, in under a minute, and it reaches whoever handles it.
Read the story