From a figure in a report to the hours behind it
Select a figure in a report and open that employee's day on the time entries screen, in a new tab, with the employee already found.
Checking last week’s hours, you spot a figure that looks off: five hours where you expected eight. To see why, you leave the report, open the time entries, pick the day and search for the person. By then the report is gone, and so is the next figure you wanted to check.
A figure in a report stands for one employee on one day. Agromigo opens exactly that day for you, in a new tab, with the employee already found. The report stays where it was.
In this video
Migo shows you how to open the time entries behind a figure in a report, in a new tab.
The report. A work hours report runs for last week: one line per employee, one column per day, and the week’s total at the end. Every figure is the hours one employee worked on one day.
- The period. Pick Last week from the presets on the left of the period picker, then Apply in its bottom right corner.
- The clock icon. The icon of a clock, just left of the download icon, opens the entries behind a figure. It stays grey until you pick one.
- Not a total. A week’s total covers more than one day, so clicking it leaves the clock icon grey.
- A figure. Click one employee’s hours on Wednesday.
- The tooltip. The clock icon turns on, and its tooltip names the employee and the day it will open.
- The day behind it. The time entries open in a new tab, on that day, with the employee already found and their day open.
- Check and correct. Here you check their timeline and entries, and correct what is wrong. The report stays open in its own tab.
- Everyone again. The employee’s name is in the search box, top left. Clear it to see everyone on that day again.
Tips
- Double-click. A double-click on a figure opens its day straight away, without the trip to the toolbar.
- Use the arrow keys. Move from figure to figure with the arrow keys. The clock icon follows the figure you are on.
- Days, not weeks. The day comes from a date column, a value spread across dates, or a date in Rows. It must be grouped Daily: a week or a month spans several days, and the time entries screen shows one.
- The whole day. The time entries screen shows everything recorded that day, including activities that the filters of the report leave out.
- Who sees it. The clock icon shows on reports about time entries, to anyone who may open the time entries screen.
Read more
The user guide explains the report screen in Reports, and checking and correcting a day in Time entries.
Try it free for 1 month.
More stories
-
 1 min
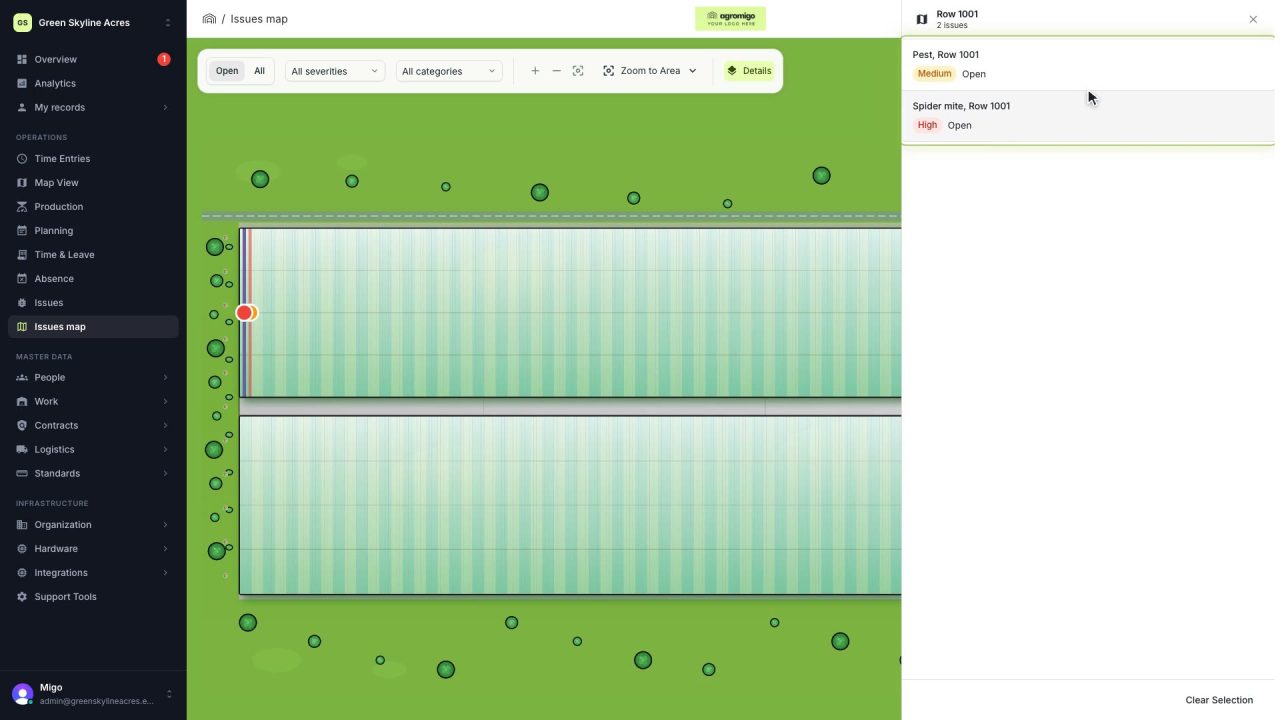
See on one map where every open issue on your site is
The Issues map colours every work area by its most severe open issue, so you see at a glance which rows have a problem and how serious it is.
Read the story -
 1 min
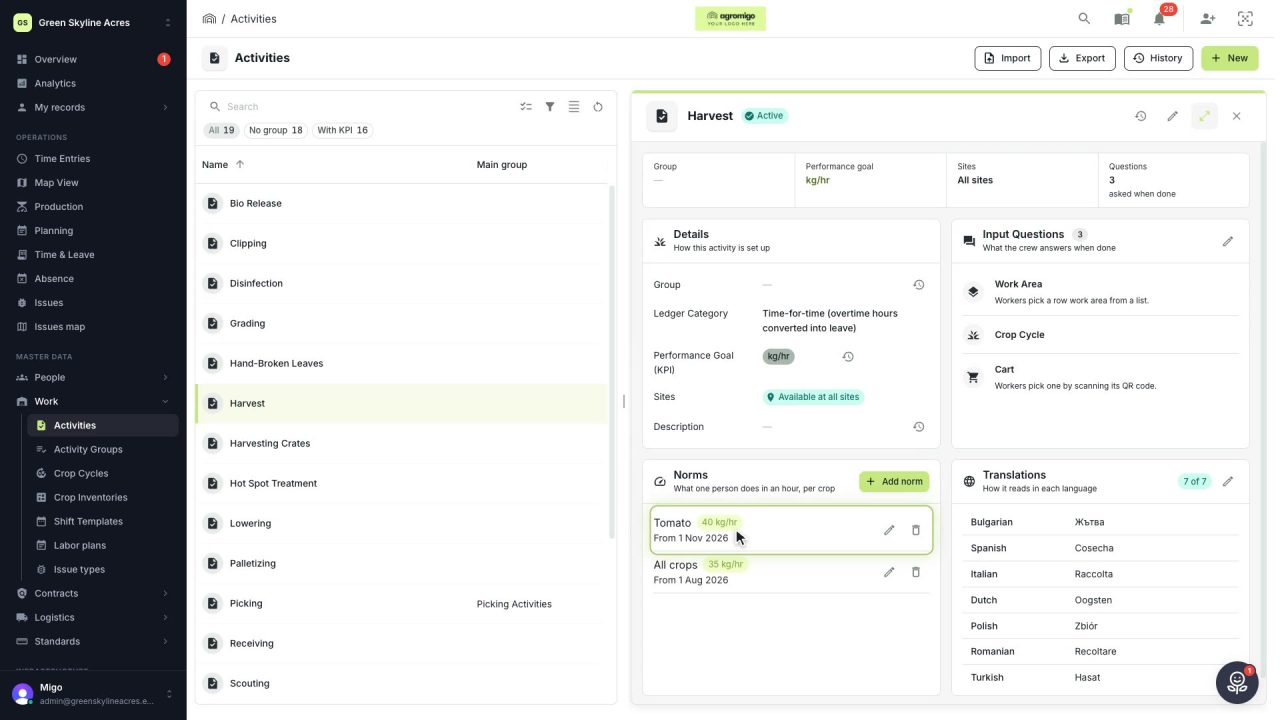
Know how fast the work goes, per crop
Set what one person does in an hour for each activity, per crop cycle and season, so every labor plan turns a target into the hours and people it takes.
Read the story -
 2 min
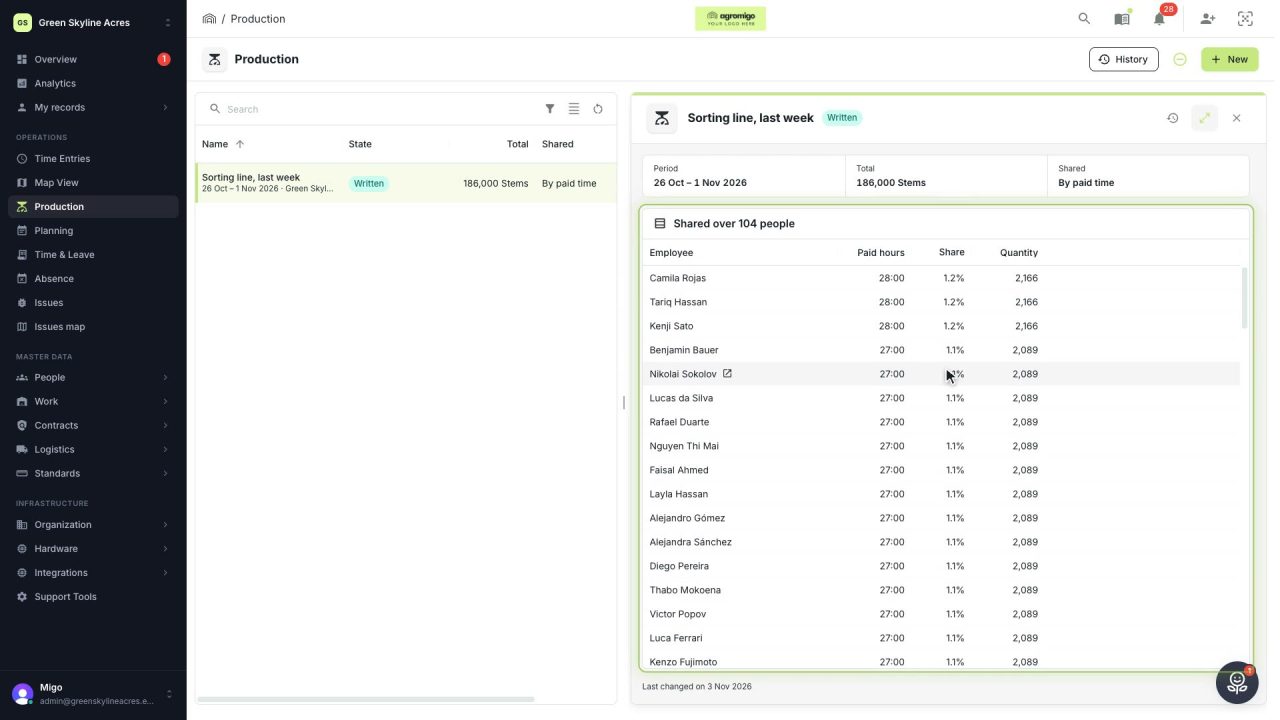
Share a week of production over the people who did the work
A total that is only known in bulk, such as a week of chrysanthemum stems from the sorting line, shared over everyone who worked by their paid hours, onto their own time entries, where it becomes stems per hour per person, team and crop.
Read the story